
The role of flow of funds indicator in day trading
I have analyzed flow of funds in daily, weekly and monthly chart, now let's look
how it performs in minutes chart.
As a matter of fact, the analysis of flow of funds indicator in minutes chart is
almost the same as is in daily, weekly and monthly chart.
The main observation points are:
- Divergence between price and flow of funds
- Significant difference between long term (orange) and short term (light blue) flow of funds
- fluctuation in flow of funds indicator in correlation with zero line
Differences are: the longer the time period is, the greater percentage needs to
be used to determine divergence. on the opposite side, smaller percentage should be deployed to detect divergence
if it's for short term. For example, divergence in a monthly chart should be at least 5% or higher
while in the 15 mins chart shall be no more than 0.5%
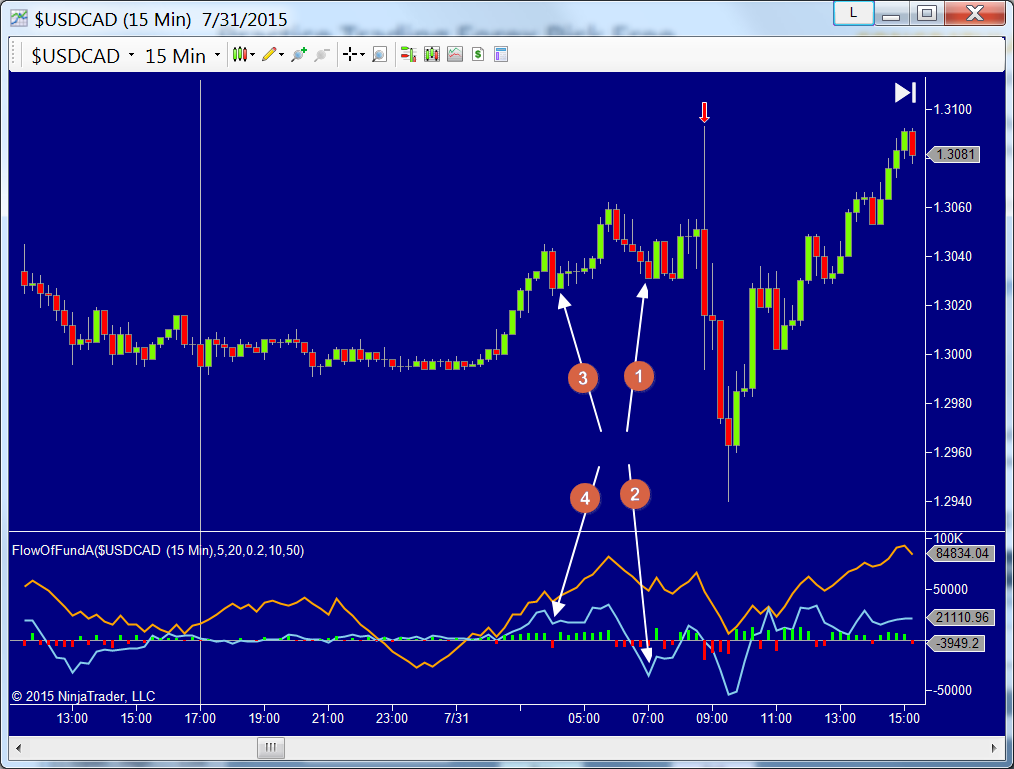
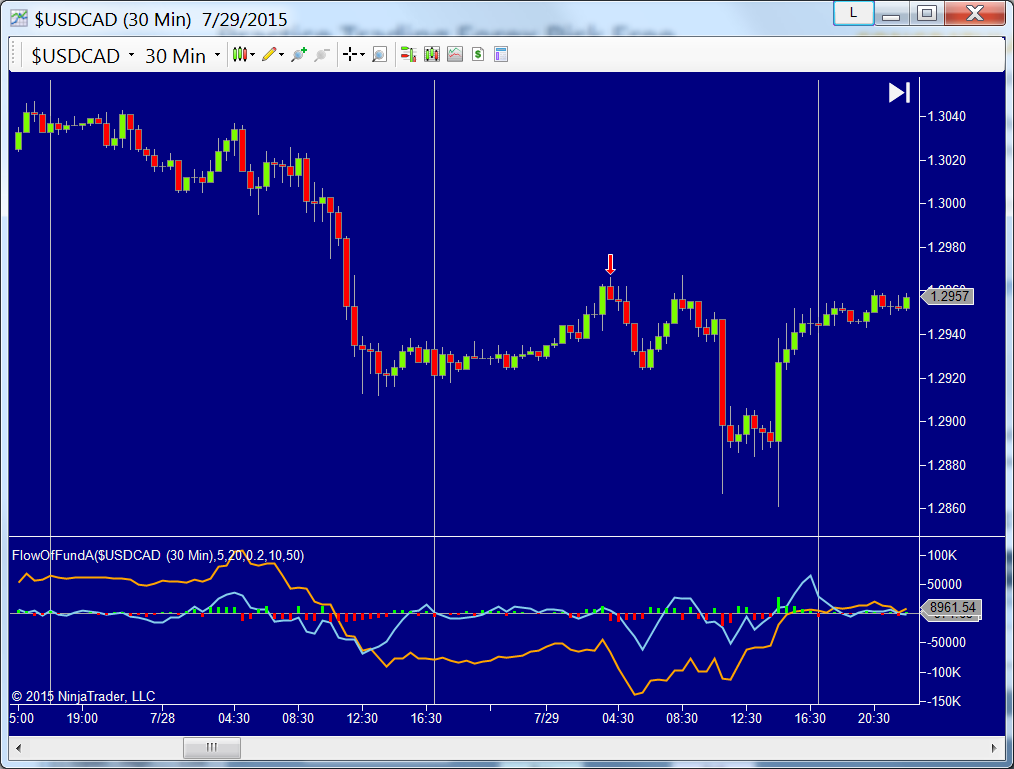
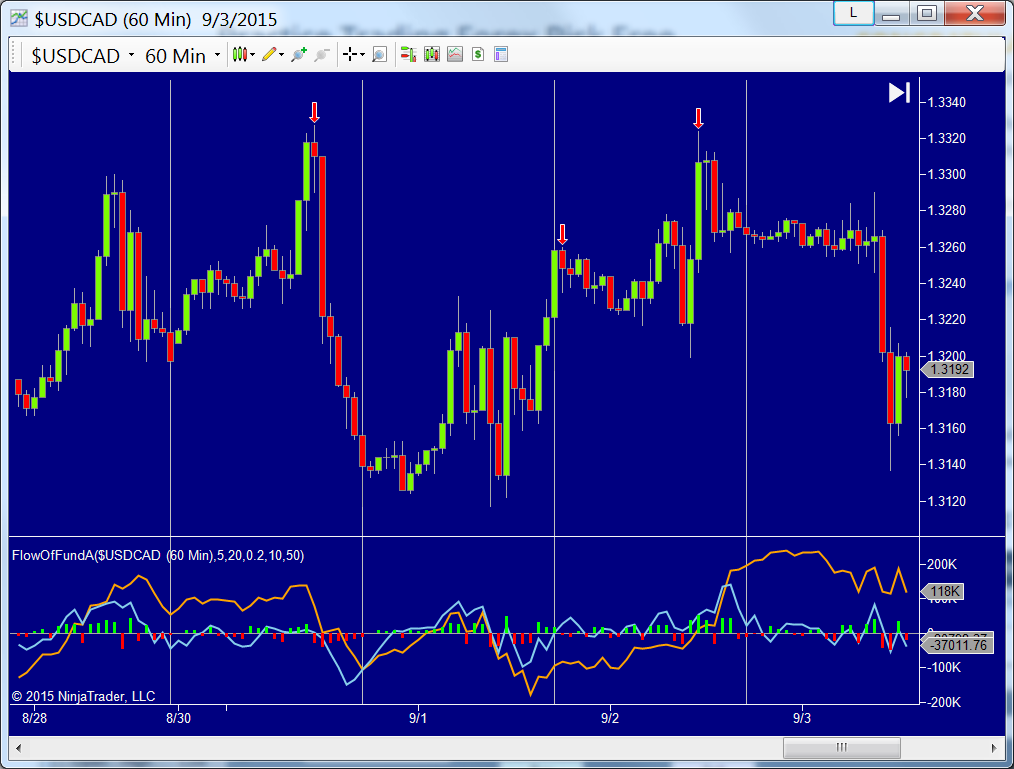
In the images below, the Red arrow pointing down is the signal that is automatically generated by
divergence function.
In the chart below, price has pulled up sharply before the crash, but funds are
in outflow trend, pay attention to the position of four white arrows in the
chart
below The short-term FOF (light blue line) breaks through horizontal line (arrow 2)
when prices are about the same evel at arrow 1 and arrow 3,
but the FOF
indicator (arrow 4) that corresponding to price level 3 is above horizontal
line. This is a clear signal of capital flow change.
Anyone that's familiar with chart pattern will identify this as a classic head
and shoulder top pattern.
In the chart below, there is an obvious divergence between price and short term FOF indicator
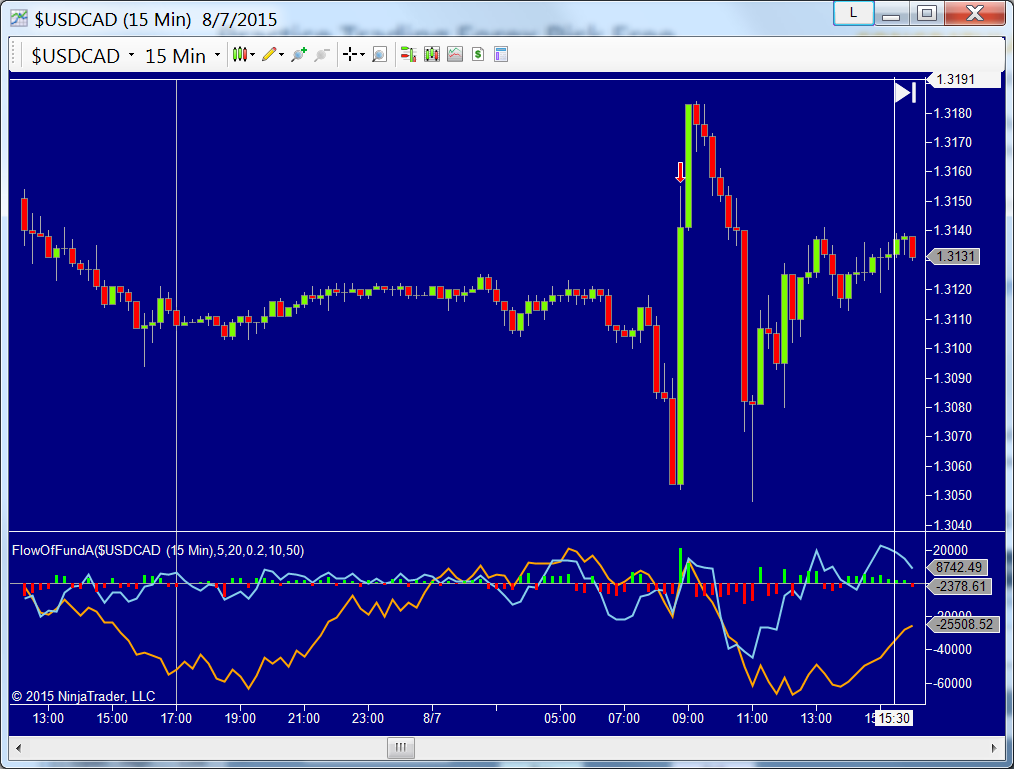

Also a very clear divergence between price and FOF indicator, the trend is almost
the same as the chart above.

The divergence between price and FOF is not so obvious , which is hard to spot without
indicator.
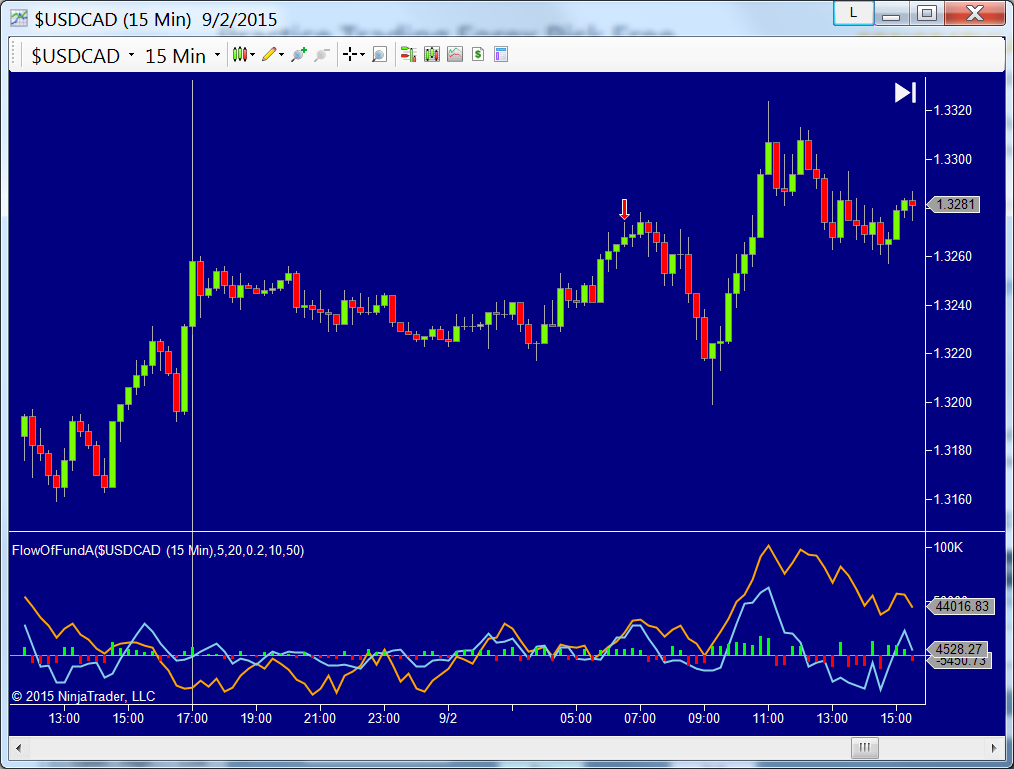
Relatively obvious divergence between price and short term FOF indicator

Very clear divergence between price and FOF

Not so obvious divergence between price and FOF, followed by an abrupt rounding
top pattern
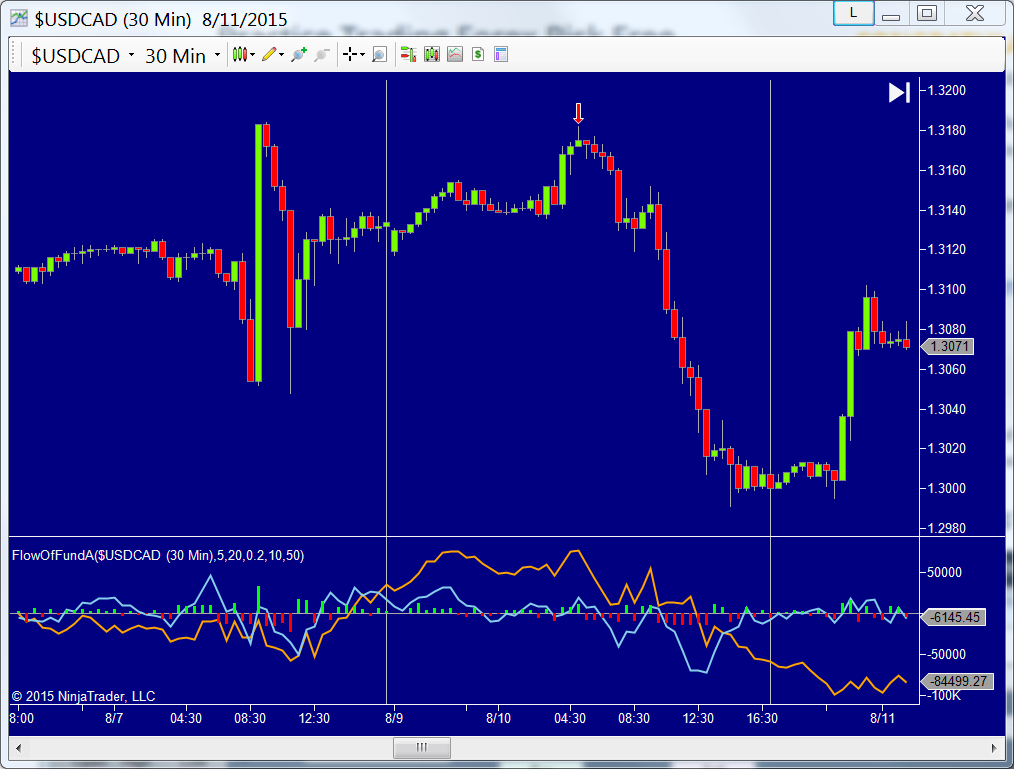
Not so obvious divergence, price action: M top, followed by a small W bottom with a rebound.
Very obvious divergence between price and FOF, you can tell without signals.
The divergence is not very obvious. Price started to climb after 8.21,
but FOF failed to follow the upward trend, instead it remained flat, which
indicated possible risks associated with correction.

For day trading, most people prefer oscillator or indicator with reversal
signal, rather than a volume related indicator. Nevertheless, proficiency with FOF will bring unexpected results. Because FOF
can provide indication before the change of price trend, while oscillators can
only generate a signal after a significant change in price.
No comments:
Post a Comment